Recent Musings
...in which I reflect on recent life experiences pertaining to work or other.
Management Adventure!
One of the most time intensive aspects of delivery management is to distribute and manage status communications. When I started running projects, at least several hours a week were spent generating throw-away content related to the week’s status and then presenting that at least one hourly forum, and of course answering subsequent questions, mitigating the “telephone game” and generally keeping the ship in order.
Expanding this mathematically to a recent program, the weekly cost of a throw-away status report could be roughly computed as follows:
(15 Project Managers x 1 hour of status prep) + (15 Project Managers x 1hr of presentation) + (5 Program Leaders x 1hr of presentation)
= 35 Effort Hours Weekly.
Just to keep everyone in the know. That is an incredible cost for no long-term value.
A Better Way
Usage of Jira on a recent project with Pete Dunham, Tony Grozdanovski and Tony Villa-Cruz gave the PMO team a basic competence in that tool and led into potential insights on how to remove this waste with the Atlassian Stack, creativity and IT duct tape. What if we were able to standardize project delivery processes via Jira? What if we could marry that to a Confluence based status report? What if (and this was the big-one) we could get Stakeholders to accept a non-powerpoint / excel based status deliverable?
The Live Status Report is Born (Concurrently I Admit)
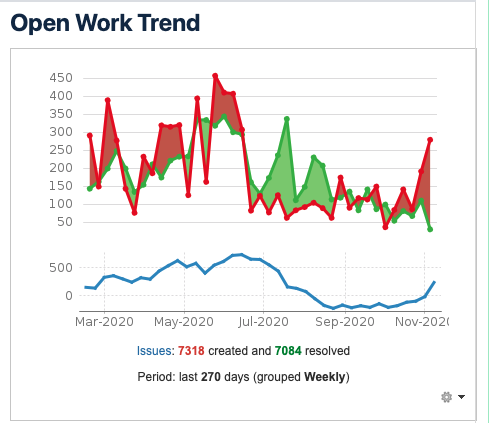
Baking those ingredients in, and with a patient but persistent change adoption push, we created a live program status report that was able to provide stakeholders with live insights into how the program was running. No more weekly rush to get powerpoint status out. No more “telephone game” / “version of truth” or other fire drills. Live, program information available whenever anyone wants it!
Data Excitement!
I started my consulting life as a data engineer. When I began at Accenture, my preferred tools were Oracle PL/SQL and Informatica, with a bit of Unix shell scripting and awk thrown in for fun. Then I moved more into management. But lately, my interest in Data Engineering and visualization has been re-awakened.
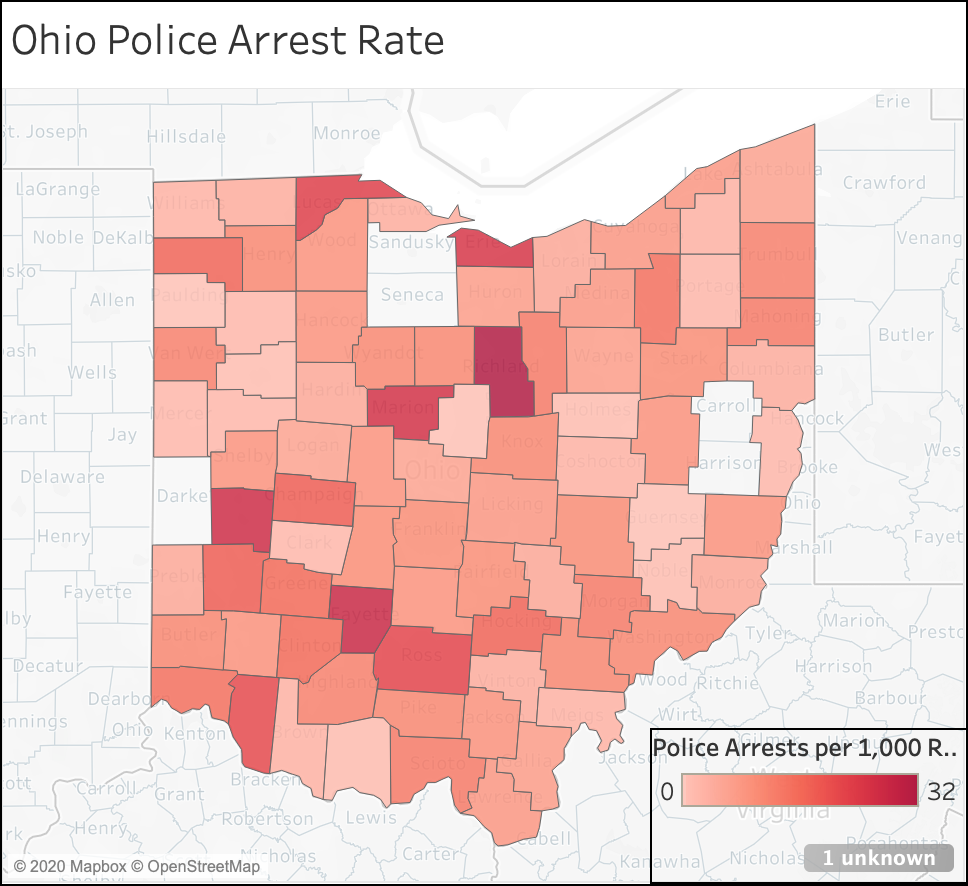
As part of my role at Avaap, I am exploring the usage of publicly available data sets and accompanying data models to support data based decisioning in policing. It’s very much in the “science project” phase at present, but it has been great fun to occasionally break away from the day-to-day official aspect of my role and get into R and Tableau. The possibilities of linking police data with other publicly collected data sets could potentially give policy makers the tools to make data-based decisions to improve the quality, safety and outcomes of police incidents. Or thus is my hope.
At some future point, I’m hoping to bake results or at least a link into this site as my science project matures.
The Joys of Self Improvement!
Most of my Accenture experience involved playing a role on a large team, in a large environment, where I could rely on my teammates to fill their specialty roles as I did mine. Eventually, I got to a point where I was insulated from the day-to-day interaction of the technology I was responsible for delivering all-together.
Realization
In my latest role, I’ve been fortunate to work with an extremely talented scrum team. On Innovate Ohio, we’ve been pushed in a number of ways to do things differently, to do more with less. It’s been a challenge, and during the course of the role the team has come to focus on the ability to wade in and add value in any and all capacities. My teammates describe the full-stack journey at fullstackproblemsolver.com.
It's Not the Destination
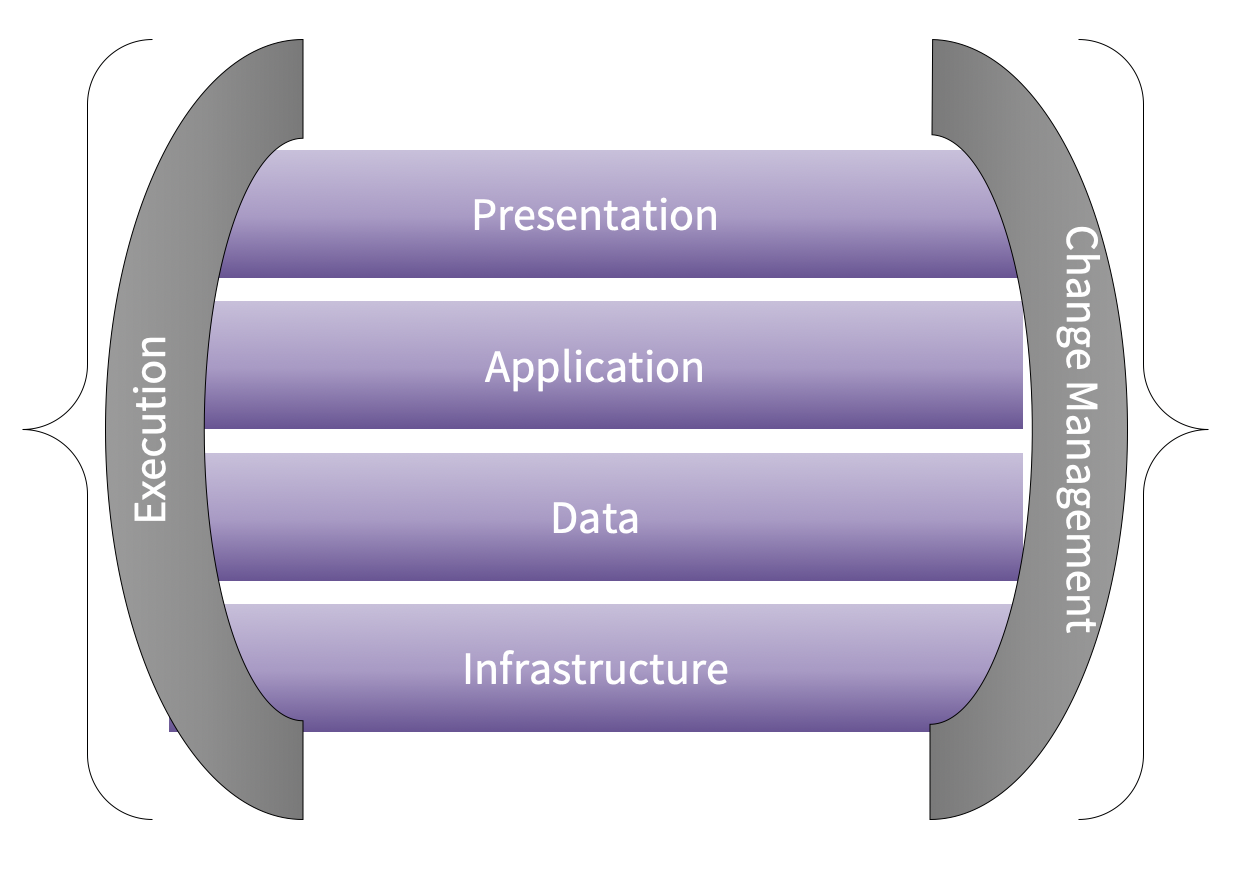
After that, I’ve been on a journey to round out and refresh my knowledge of all areas and aspects of Delivery, circa 2020. In each technology layer, I’ve been working to update and refresh my skills: Presentation (UX theory, web tech, Tableau), Application (R, Web Tech) Data (R) and finally infrastructure (AWS). My goal is to not only be able to function as a specialty soldier in a battalion, but also as a full-stack technologist to supplement my ability to lead with a renewed understanding of the tech that makes it all happen.
